Loading…
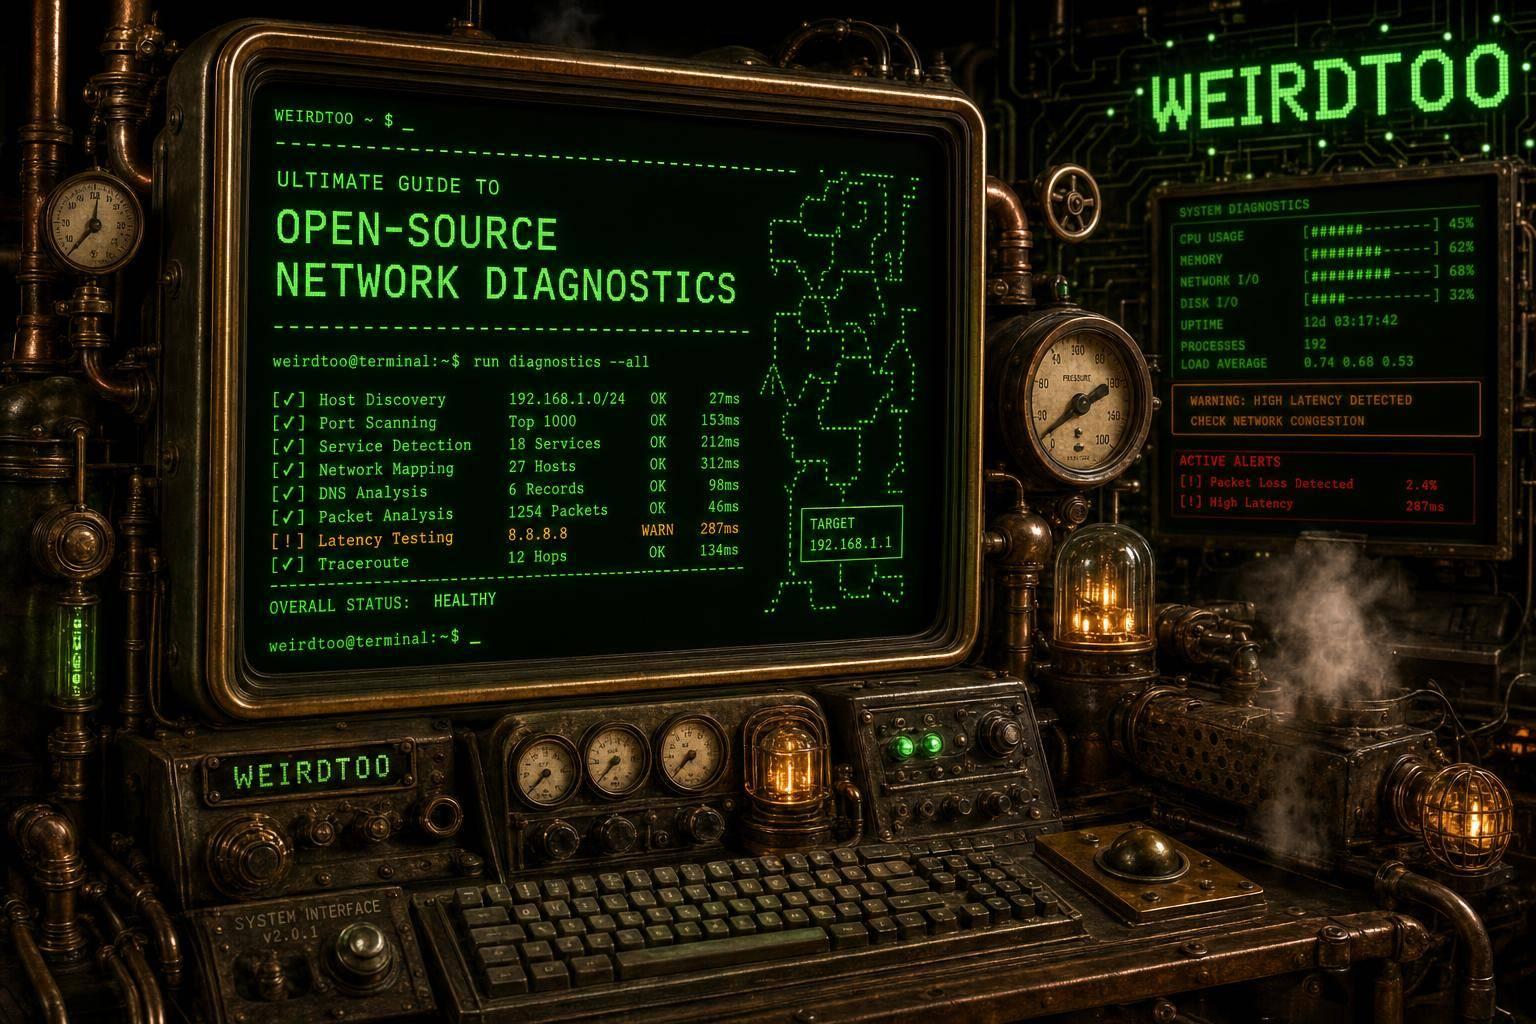
Ultimate Guide to Open-Source Network Diagnostics
By weirdtoo·July 6, 2026·11 min read
Step-by-step open-source network troubleshooting: link checks, path tests, DNS, iperf3, packet capture, and lightweight monitoring.
Ultimate Guide to Open-Source Network Diagnostics
When a network breaks, I don’t start with packet analysis. I start with a short test path: reachability, route, DNS, port, link speed, then traffic. That order cuts wasted time and helps small teams fix guest Wi-Fi, VoIP issues, random drops, and slow transfers without adding big software costs.
Here’s the article in one plain-language view:
- I use
pingandfpingto check if hosts reply and whether loss starts at the edge. - I use
mtrandtracerouteto see where delay or loss begins across hops. - I use
dig,ss,ip link, andethtoolto rule out DNS problems, dead interfaces, bad listeners, duplex issues, and CRC errors. - I use
iperf3when users say “it feels slow” and I need a throughput number in 10–60 seconds. - I use
tcpdump,tshark, and Wireshark when packets, retransmissions, or DNS replies need a close look. - I use SmokePing, Nagios, Icinga, and Zabbix when I need trend data, alerts, and remote-site visibility over days or weeks.
The main point: use the smallest tool stack that answers the question in front of you. For many teams, that means starting with 5–7 CLI tools, not a large monitoring build.
A few facts from the guide stand out:
- A port set to 1 Gbps can fall to 100 Mbps because of a bad cable.
- Even low CRC error rates can hurt TCP transfer speed enough for users to notice.
mtr -r -c 100gives a much better view of path loss than a single trace.- If
pingfails by hostname but works by IP, the fault is often DNS, not the host.
Best Open Source Network Monitoring Tools for 2026
sbb-itb-342b8b2
Quick Comparison
| Tool/Group | What I use it for | Best when | Time to signal |
|---|---|---|---|
ping, fping |
Reachability and RTT | A host may be down | Seconds |
mtr, traceroute |
Hop-by-hop path checks | Loss or latency starts somewhere upstream | 1–5 minutes |
dig, ss, ip link, ethtool |
DNS, sockets, link state, errors | The path looks fine but service still fails | Seconds to minutes |
iperf3 |
Throughput testing | Users report slowness | 10–60 seconds |
tcpdump, tshark, Wireshark |
Packet analysis | Basic checks do not explain the fault | Minutes to longer |
| SmokePing, Nagios, Icinga, Zabbix | Trends and alerts | I need history and remote-site checks | Continuous |
If I had to boil the whole guide down to one line, it would be this: check the link first, prove the path second, test the service third, and inspect packets last.
Baseline Diagnostic Tools for Fast Triage
Start with a small set of command-line tools to figure out where the problem lives: local, upstream, or inside the app. On rural links, speed matters. You want the fastest clear answer, not the longest write-up. The trick is simple: match the tool to the question, then go deeper only where the evidence leads.
| Tool | What It Tells You |
|---|---|
ping |
Host availability, RTT, and basic packet loss |
fping |
Multi-target reachability across CPE or gateways |
mtr |
Where loss or latency starts on each hop |
traceroute |
Single-path view to a destination |
dig |
Name resolution and DNS record data |
ip addr / ip link |
IP assignments, link status, and carrier detection |
ethtool |
Link errors and negotiated speed |
ss |
Listening ports and active sockets |
Ping, fping, and Reachability Checks
Start with ping. It tells you if a host is reachable and gives you RTT at the same time. But don’t overread a failed result. A failed ping does not always mean the host is down, because many servers drop ICMP while still accepting TCP connections [5].
A simple pattern helps here:
- If
pingfails on the hostname but works on the IP address, the issue is DNS, not reachability. - If both fail, keep checking the path and the local link before blaming the app.
fping is handy when you need to test many targets at once, especially during CPE or gateway sweeps [3]. It saves time and gives you a quick map of what’s up, what’s down, and what looks spotty. If reachability looks fine, move on to path and DNS checks.
Traceroute, MTR, dig, and Interface Inspection
Use traceroute when you want a one-time view of the path. Use mtr when you need to watch loss and latency across each hop over time [1][3]. That makes mtr a better fit for long-haul or wireless paths, where short bursts of trouble may not show up in a single trace. And if you see * * *, don’t panic. That usually means a router is not replying to probes, not that the path is broken.
If the path looks normal, shift to name resolution and local interface state.
Use dig to check DNS directly. If the IP address works but the hostname does not, dig helps confirm whether name resolution is the problem [8][3].
Then check the local system with ip addr, ip link, and ss. These tools show IP assignments, carrier state, and which services are listening [1][6][9]. If ip link shows NO-CARRIER, stop there and fix the link first. No point chasing app issues when the interface itself has no live connection.
ethtool helps with the next layer down. Run ethtool -S on any interface that looks suspect and check for CRC errors [6]. Even a small stream of errors on a high-speed link can drag down TCP throughput in ways users will notice. If CRC errors keep climbing, fix the cable or connector before moving any farther.
When these baseline checks don’t give you a clear answer, packet capture and throughput tests can show the traffic-level details that simple reachability tests miss.
Packet Capture and Performance Testing Tools
When baseline checks show something is wrong but don’t show why, pick the tool based on the kind of problem in front of you. Use throughput testing for speed issues. Use packet capture for protocol issues.
Wireshark, tcpdump, and tshark for Packet-Level Analysis
tcpdump is the best place to start on a remote or headless Linux device, like a router or access point. It works well over SSH, uses little overhead, and supports kernel-level filtering to keep captures lean. Save traffic to a file with tcpdump -w capture.pcap, then review it later in Wireshark [1][5].
A common workflow is simple: capture on the device, move the file to your laptop, and inspect it there. Once you load the .pcap, use display filters like tcp.analysis.retransmission or dns to narrow in on the traffic that matters [4][5].
tshark lands between the two. It uses Wireshark’s dissection engine, but it runs fully in the terminal. That makes it handy for scripted field extraction or remote inspection when tcpdump alone isn’t enough and a GUI session isn’t an option [7].
| Tool | Interface | Best Use Case | Remote Suitability | Learning Curve | Output Format |
|---|---|---|---|---|---|
| Wireshark | GUI | Detailed analysis, visual debugging | Low (requires GUI) | Moderate to high | .pcap, .pcapng |
| tcpdump | CLI | Quick captures on routers and edge devices | High (SSH-friendly) | Moderate | .pcap |
| tshark | CLI | Scripted analysis, remote deep inspection | High | High | Text, .pcap, .pcapng |
Use -n or -nn to skip reverse DNS lookups during capture. If the link is already congested, name resolution can slow troubleshooting even more [5].
iperf3, MTR, and SmokePing for Throughput, Latency, and Jitter
Once throughput looks fine, the next step is checking whether the path stays steady over time.
iperf3 is the fastest way to see whether a physical link is hitting its rated speed. Run server mode on one end and client mode on the other, and you can get a TCP throughput result in less than a minute. If file transfers feel slow, start with iperf3 to measure raw throughput. If throughput looks normal but the app still hangs, switch to packet capture and inspect the protocol exchange. If a new backhaul link comes in far below its rated speed, look for bad cables or port negotiation errors before blaming the ISP [2].
After that, run mtr -r -c 100 to check whether packet loss shows up off and on across the path [1][8]. SmokePing looks at the same path from a longer time horizon. It runs all the time from a server and graphs latency, jitter, and packet loss over days or weeks. On rural fixed-wireless links, that long view is often the best way to match drops with weather or interference patterns.
| Tool | Primary Metric | Setup Effort | Typical Run Time | Use Type |
|---|---|---|---|---|
| iperf3 | Throughput (TCP/UDP) | Moderate (server + client) | 10–60 seconds | Reactive |
| MTR | Path latency and loss | Low (single command) | 1–5 minutes | Reactive / Proactive |
| SmokePing | Latency, jitter, and packet loss trends | High (server-based config) | Continuous | Proactive |
Monitoring and Alerting Platforms for Ongoing Visibility
One-off tools help you answer a question right now. Monitoring does something different: it shows when a link, host, or service starts to drift before customers feel it. SmokePing is good at showing path trends. These platforms take the next step by turning that visibility into alerts for hosts and services.
Nagios, Zabbix, and Icinga for Host and Service Monitoring
Nagios works well for small teams because its plugin-based setup is simple and gives you clear alerts without much overhead [7].
Icinga handles the same core job, host and service monitoring, while giving teams more flexible checks and alerting options.
Zabbix goes further with broader monitoring. It includes discovery, auto-registration, SNMP, and proxy-based collection [7]. That proxy model is especially helpful for rural operators with remote sites, since it lets you collect data locally even when the WAN link is unreliable [7]. Zabbix also includes trend forecasting, which can help you spot trouble before it turns into an outage [7].
Use the table below to choose the lightest alerting layer that fits your network.
| Tool | Main Purpose | Data Collection | Alerting | Best Fit |
|---|---|---|---|---|
| Nagios | Classic host and service monitoring | Plugin-based checks | Simple, reliable | Small teams that want a straightforward alerting layer |
| Icinga | Host and service monitoring | Plugin-based, flexible checks | Flexible alerting | Teams that need more check customization |
| Zabbix | Broader network monitoring | Agent-based, agentless, and SNMP | Built-in alerting with trend forecasting | Small or rural operators with remote sites |
Once alerts are in place, the next step is graphing and device visibility.
Workflows, Tool Selection, and Final Takeaways
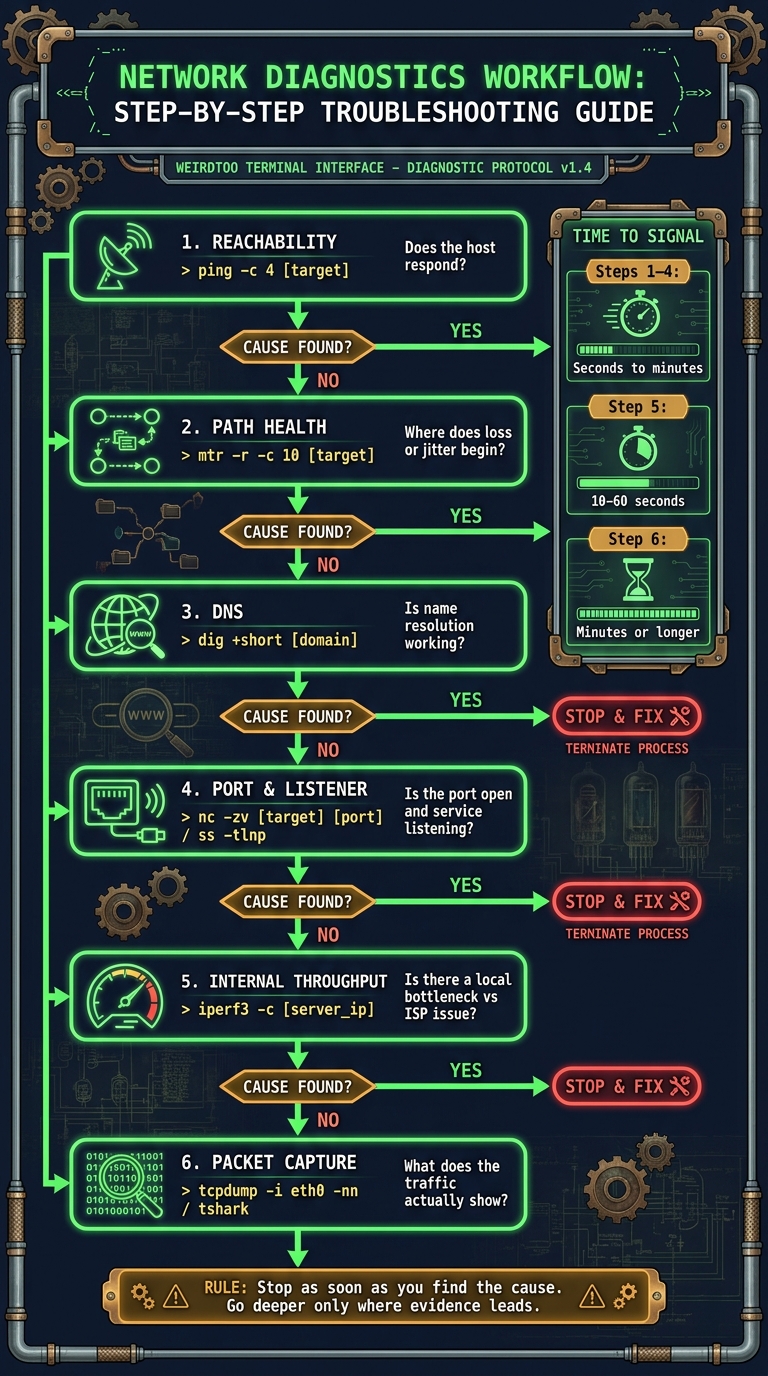
Network Diagnostics Workflow: Step-by-Step Troubleshooting Guide
A Step-by-Step Diagnostic Workflow for Small and Rural Networks
When a customer says something is broken, don't jump straight into packet capture. Start with the simplest checks first, then go deeper only if those early steps don't explain what's failing.
Work through this sequence in order, and stop as soon as you find the cause:
- Reachability: Run
ping -c 4 [target]to see whether the target responds at all. - Path health: Use
mtr -r -c 10 [target]to spot the hop where loss or jitter begins. - DNS: Run
dig +short [domain]to rule out name resolution issues. - Port and listener checks: Use
nc -zv [target] [port]to test the port, andss -tlnpto confirm the local listener. - Internal throughput: Run
iperf3 -c [server_ip]between two internal points to separate a local bottleneck from an ISP issue [2]. - Packet capture: Use
tcpdump -i eth0 -nnortsharkonly if the earlier checks still don't isolate the cause.
If those checks still don't explain the fault, then move to packet capture.
If ping or traceroute is blocked, use traceroute -T -p 443.
How to Choose a Lean Open-Source Tool Stack
Use the incident workflow for break-fix work. For day-to-day operations, pick the stack level that matches the amount of visibility you need.
Choose the smallest stack that solves today's problem.
| Maturity Level | Recommended Stack | Primary Use Case |
|---|---|---|
| Level 1: Ad-hoc | ping, mtr, ss, nc, dig |
Fast triage and reachability checks |
| Level 2: Visibility | Zabbix, LibreNMS, SmokePing | Historical latency and device monitoring |
| Level 3: Advanced | tcpdump, Wireshark, iperf3 |
Deep packet analysis and performance validation |
For rural operators managing remote sites, documented runbooks and versioned checklists matter just as much as the tools.
Conclusion: The Tools and Habits That Matter Most
The tools matter less than the habit: check things in the same order every time, then document what changed.
Visibility beats guesswork. Keep the stack small, document the workflow, and review it after every outage.
FAQs
Which tools should I install first?
Start with the core utilities that ship with most Linux distributions. They help you troubleshoot one layer at a time, from simple reachability checks all the way to app-level issues.
Install the core set with the command shown above. Then begin with ping, ss, and traceroute or mtr. Those tools give you a solid first pass.
When you need a closer look, move to tcpdump. And if you prefer a graphical interface, use Wireshark.
When should I use MTR instead of traceroute?
Use mtr instead of traceroute when you're checking intermittent packet loss, latency swings, or route instability.
Traceroute gives you a one-time snapshot. mtr keeps running and updates packet loss and latency for each hop in real time.
That makes mtr a better pick when you're trying to catch sporadic problems or route changes while the test is running.
How do I know if the problem is DNS, the link, or the app?
Start at the bottom of the stack and work your way up.
First, check the physical link and the IP layer with ethtool and ip route. That tells you whether the interface is up and whether traffic has a path to follow.
If the link looks fine, test DNS with dig example.com. When name resolution fails, DNS is probably the problem.
If DNS works, move to the application layer. Run ss -tlnp to make sure the service is listening on the port you expect.
Once that checks out, dig into the traffic itself with tcpdump, Wireshark, traceroute, or mtr. Those tools can help you spot retransmissions, packet drops, congestion, or even hardware failure.
Current contact path
Need Weird Network WiFi, custom apparel, or scoped help?
Use the contact form; removed product, checkout, research, and newsletter funnels stay offline.